|
Computational Toolsmiths
Software Tools for Computational Science, Engineering, and Medicine |
FirWav Real Orthogonal Filters
- Examples of Individual Filters
- Daubechies Real Orthogonal Least Asymmetric (DROLA)
- Daubechies Real Orthogonal Most Asymmetric (DROMA)
- Daubechies Real Orthogonal Least Uncertain (DROLU)
- Daubechies Real Orthogonal Most Regular (DROMR)
- Examples of Filter Families
- Daubechies Real Orthogonal Least Disjoint (DROLD)
- Daubechies Real Orthogonal Most Disjoint (DROMD)
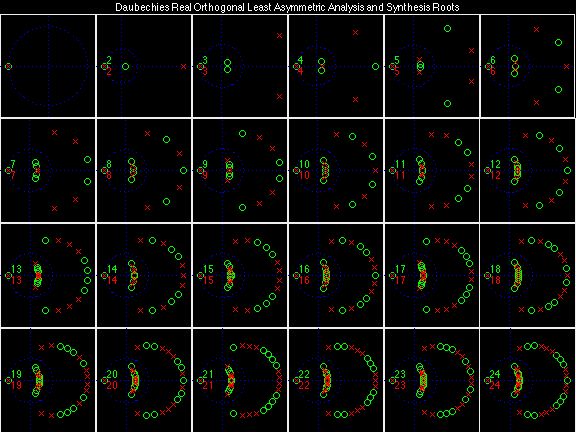
- Daubechies Real Orthogonal Least Asymmetric (DROLA)
- Daubechies Real Orthogonal Most Asymmetric (DROMA)
- Daubechies Real Orthogonal Least Regular (DROLR)
- Daubechies Real Orthogonal Most Regular (DROMR)
- Daubechies Real Orthogonal Least Uncertain (DROLU)
- Daubechies Real Orthogonal Most Uncertain (DROMU)
Examples of Individual Filters
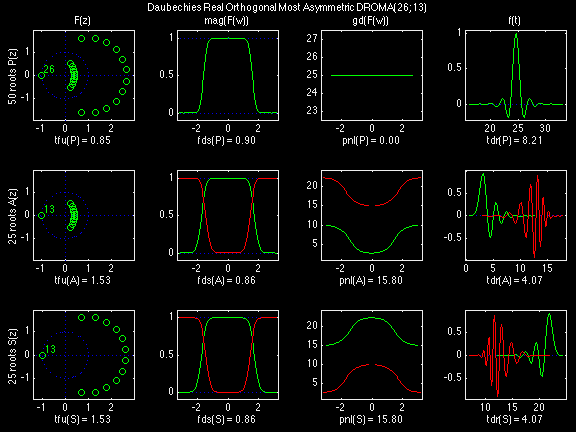
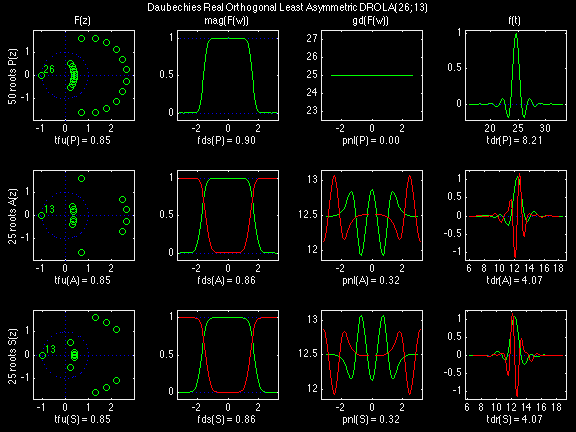
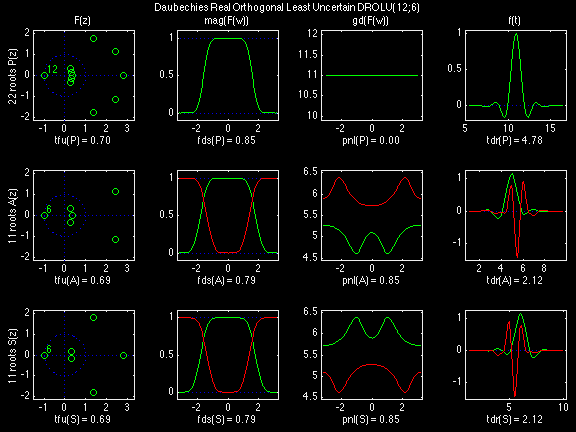
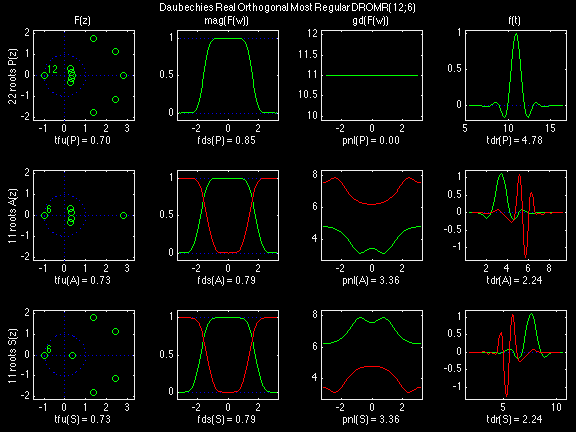
In the following examples of filters, each figure contains a matrix of subplots with rows corresponding to product, analysis, and synthesis filters, and with columns corresponding to characteristics of the filters in the complex z domain, the frequency domain, and the time domain.
Figure legend abbreviations for the plots on this page include:
- f(t) = filter in time t domain;
- F(z) = filter in complex z domain;
- F(w) = filter in frequency w domain;
- mag(F) = magnitude of F(w);
- db(F) = magnitude of F(w) in decibels;
- ang(F) = phase angle of F(w);
- up(F) = unwrapped phase angle of F(w);
- pd(F) = phase delay of F(w);
- gd(F) = group delay of F(w);
- P(z) = Product filter;
- A(z) = Analysis filter, primary spectral factor of P(z);
- S(z) = Synthesis filter, complementary spectral factor of P(z);
- tfu = Time-Frequency Uncertainty;
- tdr = Time-Domain Regularity;
- fds = Frequency-Domain Selectivity; and
- pnl = total Phase NonLinearity.
Scalets (lowpass filters) are in green; wavelets (highpass filters) are in red. In the z domain plots, the number near the zero at z = -1 indicates the multiplicity of that zero. This number determines the theoretical number of vanishing moments of the corresponding wavelet filter.
Daubechies Real Orthogonal Most Asymmetric (DROMA)
Daubechies Real Orthogonal Least Asymmetric (DROLA)
Daubechies Real Orthogonal Least Uncertain (DROLU)
Daubechies Real Orthogonal Most Regular (DROMR)
Examples of Filter Families
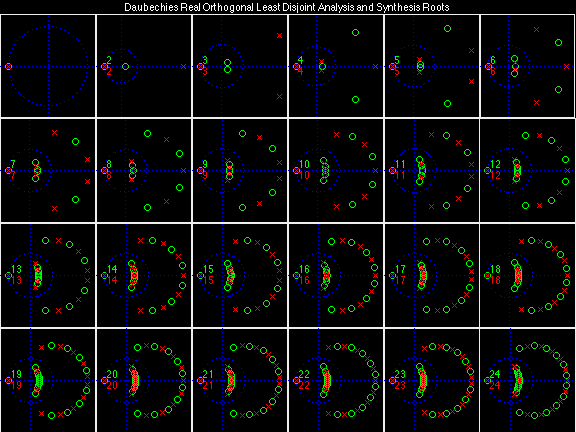
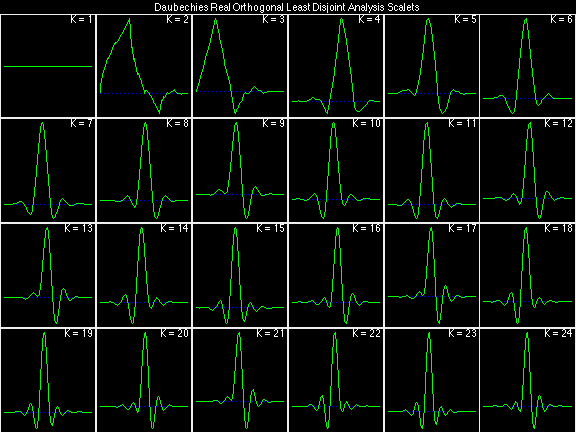
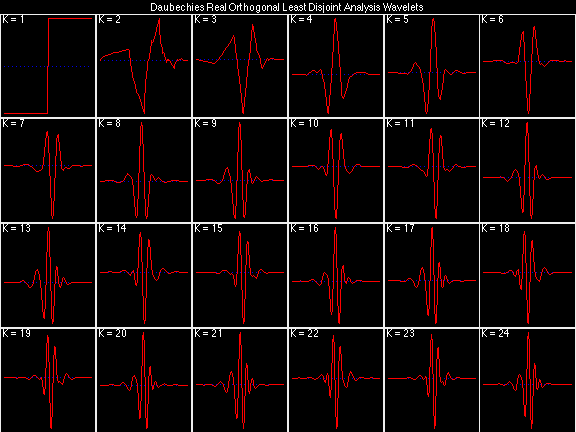
Daubechies Real Orthogonal Least Disjoint (DROLD)
Daubechies Real Orthogonal Most Disjoint (DROMD)
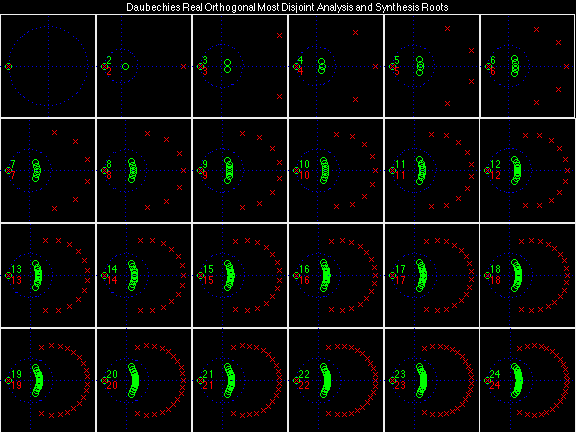
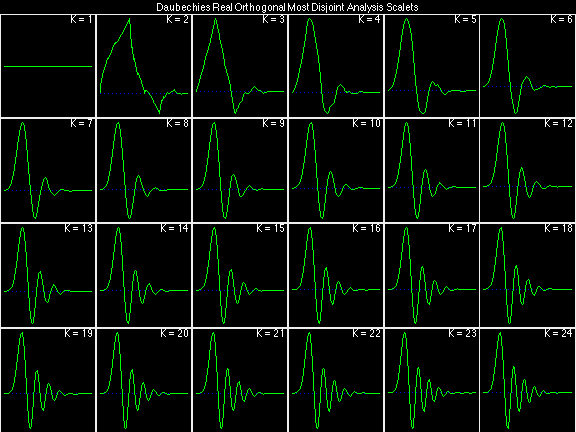
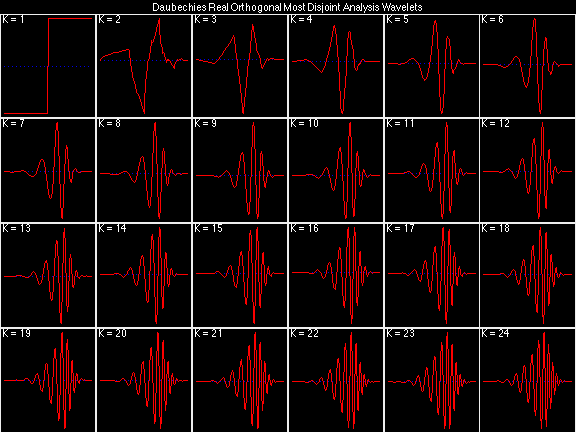
Daubechies Real Orthogonal Least Asymmetric (DROLA)
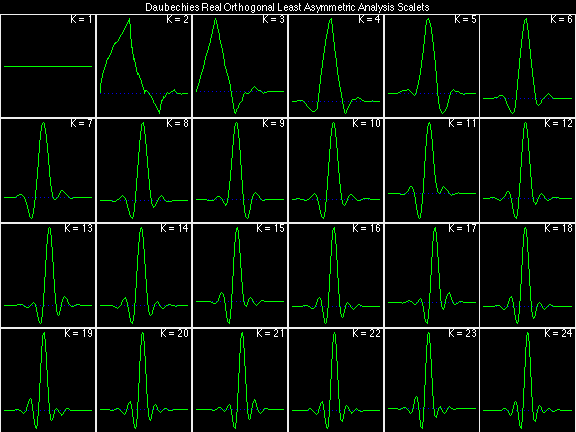
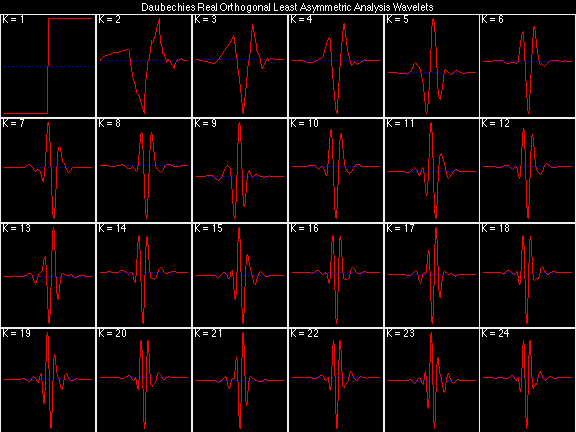
Daubechies Real Orthogonal Most Asymmetric (DROMA)
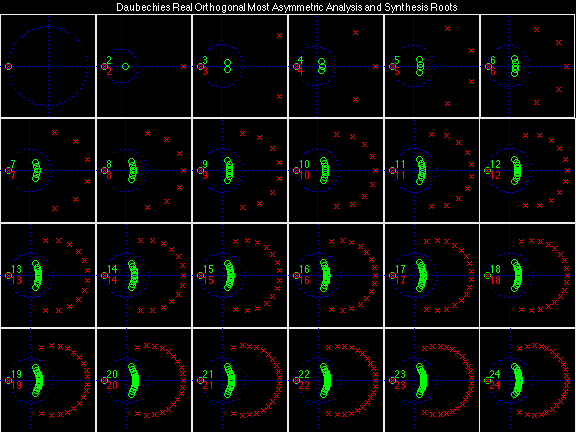
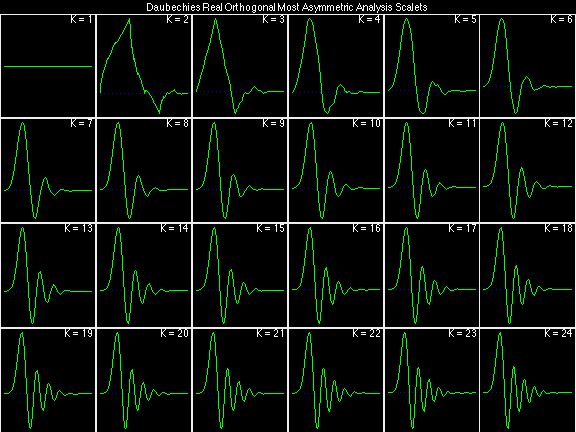
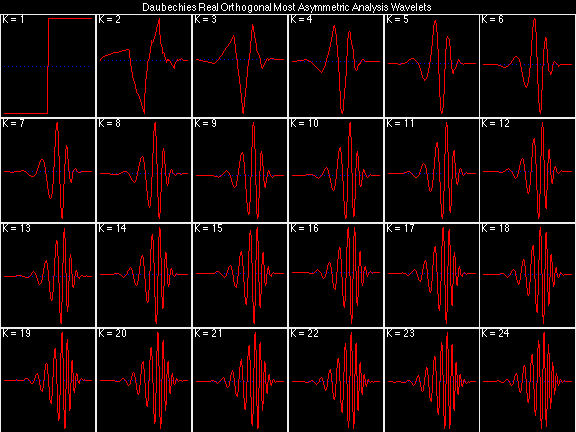
Daubechies Real Orthogonal Least Regular (DROLR)


Daubechies Real Orthogonal Most Regular (DROMR)
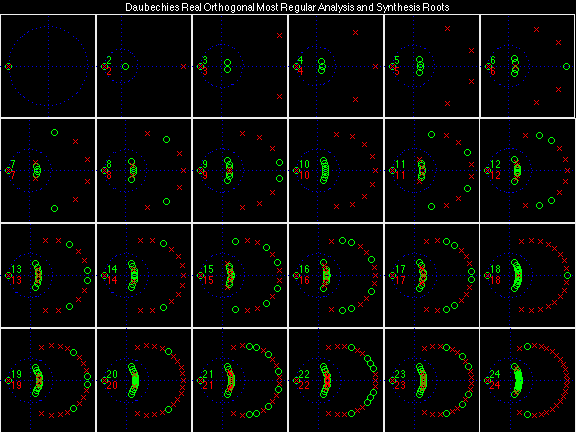

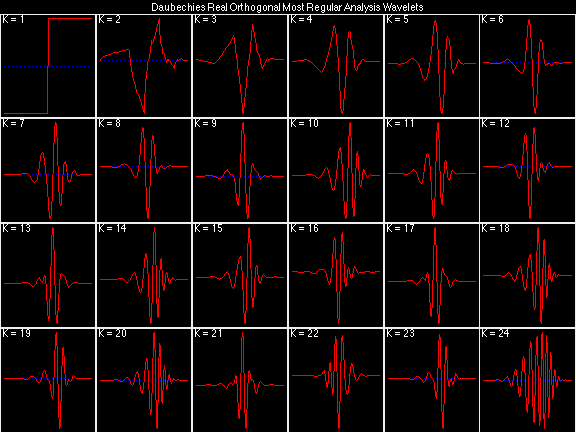
Daubechies Real Orthogonal Least Uncertain (DROLU)
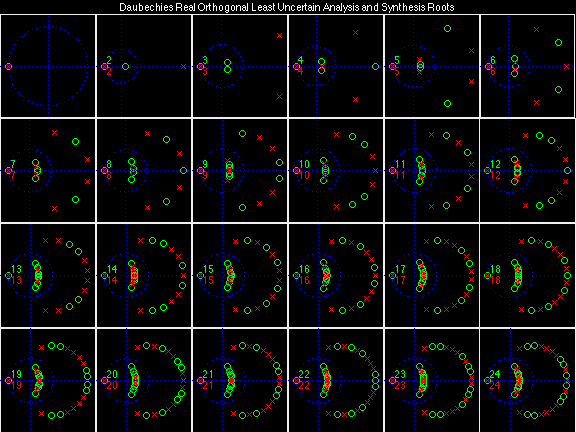
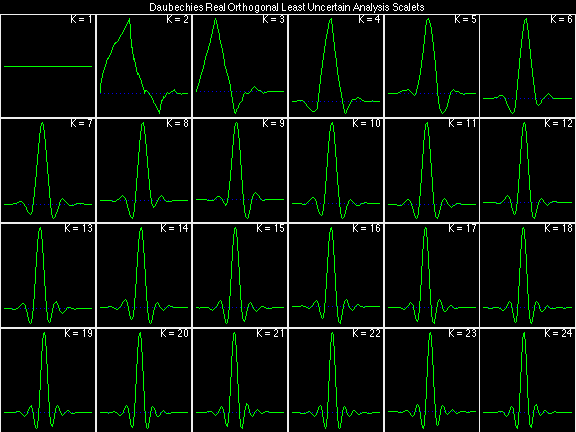
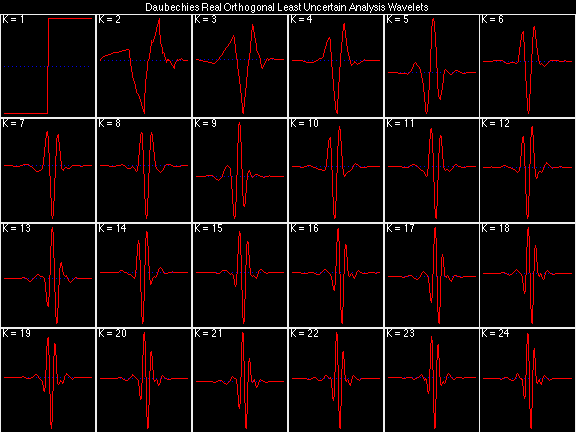
Daubechies Real Orthogonal Most Uncertain (DROMU)


